
How to Become a Better Product Manager - Analytics and Instrumentation
Product analytics and instrumentation should be a product manager's closest and best friend.


Product analytics. It’s one of the most valuable quantitative tools for making effective decisions because it tells you exactly what your user-base is doing with your product, if properly instrumented.
Yet, I’ve worked with many product managers who have underutilized this value, unable or unwilling to perform this analysis or even consider it a factor in their requirements. Some have legitimate reasons - perhaps their company doesn’t allow it. Others, less so - some view the work as beneath them, or others are simply intimidated.
Yes - intimidated. Because it seems technical and it seems heavy on data, product managers can potentially shy away from digging deeply into learning how to wield analytics. Instead, they toss any analysis needs over to a data science organization, greatly extending their feedback-decision-action loop.
This behavior prevents them from being able to deeply understand their users’ behavior. If all you’re getting is a summary of an analysis, then how do you quickly get answers to ad-hoc questions? How do you truly understand what your users are doing at scale?
A solid understanding of product analytics, instrumentation, and analysis is a must-have for Product Managers to be maximally effective.
Product Managers must know:
The mental models of product analytics
How to identify what to instrument
How to perform basic analysis themselves (funnels, trends, tracing)
How to effectively incorporate instrumentation needs into their requirements
Regardless of the vendor (eg. Mixpanel, Amplitude, Fullstory, home-rolled, etc.), Product Managers must know the fundamentals.
This article is part of my series How to Become a Better Product Manager, which teaches the deep fundamentals of product management.
What should you instrument?
It depends, but below is what I consider table-stakes questions for any product manager to be able to answer.
Who is the user performing the action?
What action is the user taking?
What context is the user acting in?
These three questions can help you trace user behavior, and construct trends and funnels for analysis.
Who is the user performing the action?
To identify this, we can break this down into three different categories:
User identity
User demographics
User segmentation and categorization
User identity
User identity are the unique properties that allow you to uniquely identify the user so you can trace a particular user’s behavior as they use the product, and cross-analyze across other datasets if you so desire.
The primary one you should, at minimum, have is:
A record identifier tied to the specific user record in your system (eg. a user_id or account_id)
An internal identifier to identify a specific user across multiple accounts, if needed, such as a randomly generated UUID associated with multiple accounts representing a single person.
Other identifiers can be used as well - just note there may be pitfalls:
Email address is useful to easily find an account, but can change or not be present, especially if you have phone number login or other capabilities.
Phone numbers are useful, but remember that phone numbers can change hands over time.
IP address is not uniquely identifying enough - IP addresses can be shared, can change frequently, and can even represent thousands of other people (eg. a public hotspot).
Regardless of what identifier you use, associate the User Record Identifier and the Internal Identity identifier to the User’s profile for tracking. It’s sometimes helpful to also associate these details with the event as well.
Why a record identifier AND another internal identifier?
Some products require the creation of multiple accounts, which means a single person may have 2, 3, or even 4 accounts. Think multi-tenant systems, or corporate payroll systems segmented by company. Some security policies also mandate the usage of more than one account (eg. separation of admin accounts and user accounts).
If you only have a record identifier, you may get confusing or skewed analysis results.
To correct for this, you’ll need some sort of universal user identity your product generates that is associated with other accounts but separate from the account identity.
Even if you don’t think that’s the case, just remember: users do strange things. Product analytics often lose track of users due to cache, cookie settings, and multi-device behavior.
User demographics
Demographics might include age, income, country of origin, etc. and can often be natural segmentation points where user behavior starts to differ or key information useful for market expansion. Teens are likely to engage completely differently with your product than the elderly. Perhaps you find yourself getting visitors from another country where English isn’t the primary language, and you want to inform whether it’s useful to embark on an internationalization effort.
It’s harder to do that without understanding the demographics of your users.
Just be careful not to over-collect information. If you’re running a financial applicatio, then asking for income might be contextually appropriate. However, users might find it weird if you have a photo-sharing product and ask that same question.
Be judicious and make sure it’s actually relevant and useful information to collect before collecting it.
note: some analytics products auto-collect and interpret information like IP address an turn it into country. It’s imprecise, but accurate enough.
User segmentation and categorization
You’ll probably have some unique characteristics particular to your industry, offerings, and market that you may want to segment on.
Maybe you have some vetted personas that you want to tie all of the users to. Perhaps your company has separated its customer base by a metal level such as bronze, silver, and gold. Maybe you want to track how big of an organization the user is in.
Whatever you want to use to categorize and segment users by, you can track so that you can look at behaviors across you various categories.
Note: Categorization can be anything that’s relevant to your company, product, and industry. In the past, I’ve categorized users by the kind of sport they played, which was strongly correlated with success outcomes in the product I was working on.
What action is the user taking?
Once you have identity, you should also be tracking what the user is actually doing.
There are two kinds of “doing” events:
Interaction events
Business events
Interaction events
Interaction events are things that the user has done to interact with your product or system.
They are typically abstract, generic, and mechanical in nature, such as:
Viewing a page or element
Clicking/tapping/holding a button, link, heading
Hovering on / off an element
You’ll often want to answer questions like “How many times did the user click the thumbs up button?”. Tracking interaction events at a generic, automated level lets you answer those quickly.
These are also useful for constructing interaction funnels - you can quickly chain together a set of views and clicks to see where users are dropping off a funnel.
However, because users can interact with thousands, tens of thousands, or even hundreds of thousands of elements in a single product, you want to track a second, more specific set of events to make you analysis even more useful / faster: business events.
Business events
The second set of events to collect are business events. These are events that are relevant to your business.
They aren’t specifically measuring a user interaction (such as a click or a view) but rather some sort of business-relevant outcome or action which may or may not be triggered by the user via an interaction.
Generic product events might include things like:
Signed up
Logged in
Deleted account
Changed password
Requested password reset
Reset password
Changed email
Subscribed to newsletter
Unsubscribed from newsletter
If you had an eCommerce site, some business events might be:
Item added to cart
Item removed from cart
Item purchased
Item page viewed
Cart viewed
Checkout started
Checkout completed
Checkout failed
Upsell displayed
Return requested
Return denied
Examples for a business dashboard might be:
Chart viewed
Export downloaded
Export requested
Search conducted
Record approved
Record denied
Team member added
Billing info updated
Billing type changed
You get the picture. The important part is to identify what events might be important to you or the business to track - which events lead to outcomes?
What context is the user taking action in?
Finally, you’ll likely want to be able to segment and analyze behavior depending on the context of the user’s actions.
Some products offer a multi-tenant whitelabel capability to customers. Events might occur particular to a specific customer’s environment or whitelabel, and you may want to track these events separately from the global perspective.
Perhaps your application has multiple entry points, and you’ve identified that users behave different depending on which upstream they came from. You can track this as well to establish the context of the user’s interaction with your product.
Useful contextual items include:
The environment or account being acted on (eg. a specific customer environment)
Where the user came from (eg. what page) - also known as a referrer
The device of the user (eg. mobile, tablet, desktop, laptop)
The browser of the user (eg. Chrome, Safari)
Context is, well, contextual - so be sure to think through how you might want to segment and analyze your data.
Add properties to your events so you can analyze them
You’ll always want to make sure that each of your events has a set of properties that describes that you can pivot on to answer your questions.
For example, the following events might have as properties:
page viewed event
page name
checkout completed event
items in cart
total price
payment type
prices in cart
coupon code used
search conducted event
search term used
filters applied
# results returned
search time taken
If we used the above as an example, we could answer questions like:
Which coupon codes resulted in an increase in total price for a checkout vs. a decrease in total price of a checkout?
Checkout completed, summing up total price, broken out by coupon code compared to
Checkout completed, summing up total price filtered by those without a coupon code as a baseline
What are users attempting to purchase or search for that we might want to find sellers to stock?
Search conducted, filtered by those returning no results, broken out by search term used
Is there a correlation between payment method and the total amount of a checkout?
Checkout completed, summing total price, broken out by payment type
Did users who viewed the new “Halloween special” marketing page buy more items than users that didn’t?
Checkout completed, broken out whether there was a Page view for “Halloween special” or not, summing up total price
The questions are obviously limitless. Having the right properties and events will help you answer them. Whatever you might need to be able to answer a question you want to ask is fair game.
Nothing is worse than releasing a product and then wanting to answer a question, only to realize you can’t answer it because you didn’t define the instrumentation for it so you aren’t capturing the events or properties you need.
Note: data never tells you WHY your users did something, only WHAT they did. To get the “why?”, you need to talk with your users. For example - a user may have bought more items on the halloween special because it was a great upsell, or it might be because the halloween special had a defect that added warranty card products to the cart, or maybe it was because the halloween page simply showed more of a catalog than your other landing page and had easier add-to-cart UX. You’ll never know the actual reason through data alone.
Putting events together and analyzing them
With interaction events and business events, you can now start performing analysis of the events - building visualizations of funnels, trends, and behavior across the range of products.
Analyzing a funnel
Funnels are used to identify points in a flow where the conversion rate can be improved.
Funnels are constructed with a sequence of events you expect the user to go through in order, and then you can use the number of people who successfully reached the next step within a set amount of time as a “conversion”.
Analytics products typically have funnel feature built in, but if not, you can construct your own by counting the number of events or users that went through that flow fully, step by step.

For example, if you want to construct an end-to-end funnel for a checkout flow, you could look at these events in sequence:
Item viewed → Item added to cart → Checkout started → Checkout completed
Each column above shows the number of sessions that reached that step. This means you can identify areas with higher than expected drop-off to optimize.
The above example shows a total end-to-end funnel conversion rate of only 23% for events that occurred in a month. That is, 77% of people who view an item do not make it to completing a checkout (“Item viewed” → “Checkout completed”).
Looking more closely, a large portion of drop-off is in the step from “Checkout started” → “Checkout completed”. This area is ripe for improvement: starting a checkout is a high-intent signal, so optimizing this process is likely to significantly improve conversion rates.
The drop-off in sessions moving successfully from “Checkout started” → “Checkout completed” is 6.7k sessions - a staggering 70% drop-off. If your average Checkout size is $50 per checkout, that’s a potential missed opportunity of $335,000 per month.
Improving the flow might increase that to only a 35% drop-off, which effectively doubles your business outcomes from checkouts.
note: some sequences of funnels naturally have high drop-offs. Look up industry standards as a benchmark.
Analyzing a trend
Funnels provide a snapshot in a specific moment in time. It’s useful for optimization, but if you want to see results over a long period if time, you’ll want to look at a trend.
Let’s suppose you map the trend from the above example for the step “Checkout started → Checkout completed” after pivoting your team towards making improvements into that funnel.
You might see something like below:

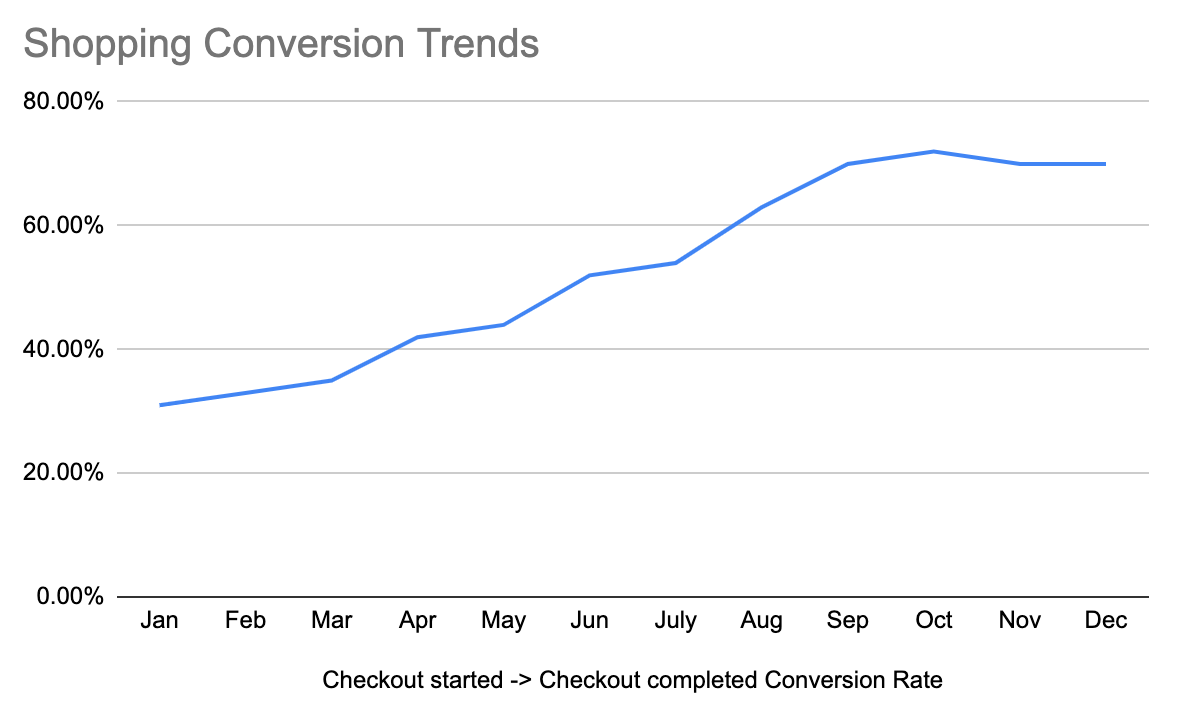
The above shows the effects of your team’s improvements on optimizing the checkout funnel, having a larger and larger impact month over month until around October, when something occurred that dropped the conversion rate. After that, it stabilizes in December. Perhaps in October, you deployed something that had a negative impact. Unfortunate, but in any case - you can see a massive long-term impact with your other improvements throughout the year.
Within a 12-month period, you were able to improve the rate from 30% to 70%, more than doubling the conversion rate. If you applied that to the same number of funnel sessions from above, this translates into an additional 3,834 successful checkouts, or capturing an additional $191,700 per month, assuming a $50 average checkout.
note: rates are not the only thing that matters. If it’s cheaper to increase entries into the funnel (that is, more people starting a checkout), then you can gain even more benefit from assuming the conversion rate holds. Always check the raw numbers in addition to the percentages. A 10% boost in top-of-funnel for 100,000 events (+10,000) is going to be significantly more impactful than a 100% boost in conversion rate for a step that only receives 1,000 events (+1,000).
Analyzing the behavior of a specific user
You may be interested in how a particular user interacted with your product. Sometimes it’s for auditing or legal reasons. Other times you may be trying to trace down a reported defect, or something that user is doing is making them particularly effective.
Because you associated your events with a particular user record identifier, you can find all events associated with that particular user, and view it as a sequenced list of interactions.
This is useful for tracing behavior, diagnosing the chain of events leading up to an error, and other items:
User ID 12345 - item viewed - 1685
User ID 12345 - item viewed - 8573
User ID 12345 - item added to cart - 8573
User ID 12345 - item added to cart - 1685
User ID 12345 - checkout started
User ID 12345 - checkout failed - unknown error
User ID 12345 - checkout failed - unknown error
User ID 12345 - checkout failed - unknown error
User ID 12345 - cart viewed
User ID 12345 - item removed from cart - 1685
User ID 12345 - checkout started
User ID 12345 - checkout completed
The above example shows there’s likely some issue with item 1685 that cause some unknown error occurred.
This is also how many “session replay” tools like FullStory work. They capture all of the user’s events and play it back for you, in sequence. It’s easier than interpreting a list of text-based events, although with current pricing significantly more expensive.
Your company very likely already has a lexicon or other events and properties already in use. Find or create a data dictionary to start becoming familiar with existing events.
Effectively defining instrumentation in requirements
In order to get any of the value from above, you need to be able to communicate to your engineers what you want to instrument. You should know what events and properties you want to capture as users interact with your product.
It’s not hard - instrumentation is just about implementing the measurements you need. However, engineers aren’t going to read your mind - you need to tell them what you’re looking for. While great product engineers might fill in the gaps, you shouldn’t cede your responsibility to them - make sure you are in lockstep.
Some ways you can provide that clarity:
Define the specific events that are important to you and the business
Explicitly write the questions you want to be able to answer
Write down factors you may want to perform an analysis on
Establish an expectation of instrumenting interactions by default
Define the specific events that are important to you and the business. You should know what you business events are important to you, and what milestones and checkpoints you want to capture as users navigate through your product. Explicitly write them down for your engineers in your requirements. For example, if you’re working on a job board product:
Major events to instrument
“Job listing created”
“Job listing archived”
“Job listing edited”
“Job listing published”
“Job listing removed”
“Job listing filled”
“Applicant applied to job listing”
“Applicant viewed job listing”
“Applicant shares job listing”
“Company shares job listing”
Explicitly write the questions you want to be able to answer. This helps engineers think about additional events you might want to be able to capture, and helps crowdsource to fill in gaps in your own knowledge. Be clear and detailed, and form and write down questions. State why you want the question answered. Set an expectation that the way to answer these questions is provided. For example:
Questions I want to be able to answer:
Does the length of the job listing influence the number of applicants it receives?
We want to inform best practices in the future.
Does sharing a job listing lead to more views?
We want to inform whether investing in better sharing tools will improve effectiveness of the listing.
Why was a job listing archived?
We want to understand whether a job listing is removed because it was filled elsewhere, or if it was not effective, or the position is no longer available.
How many applicants, on average, view a job listing before it is filled?
We want to be able to communicate to customers and in marketing the efficiency of our job board.
Did a specific applicant get their job after viewing the job listing?
We want to be able to have direct, specific conversion information for renewal negotiations.
Write down factors you may want to perform an analysis on. These can be lists of properties you want to be able to pivot on, so that engineers can ensure these are instrumented. For example:
Number of applicants
Type of company
Type of job
Salary stated in job listing
Remote-friendliness
Company size
Company location
Industry
Establish an expectation of instrumenting interactions by default. Some engineers try to instrument things on a case-by-case basis. They have to always remember to add and instrument basic user interactions like clicks. Instead, try to make room or time for engineering to work on a way for instrumentation of user interactions to be always enabled by default in a standardized way. This might require the creation of a small but powerful framework or library that automatically collects events for clicks, views, and other items. This will greatly help as you can, at minimum, reconstruct a user interaction i you forget to add a business event or find some surprising outcome.
Note: remember - not all data is valuable, and not all data is easy to get. It should be a conversation with your team to figure out which data is available and easy to get, and which might be difficult or lead to scope increases. There might even be other ways to answer the questions you have. Make sure it’s a dialogue.
Deeper analysis
That’s it on the basics, which will take you quite far. Remember - product management relies on quantitative data to inform decisions. The faster and better you get at using it, the more informed you can be.
To be effective:
Be intentional - understand what you want to answer, know, and why
Be clear - don’t hand-waive instrumentation concerns away when talking with your engineers - they need to understand what you need
Be curious - dive deep into the tools and questions to get answers, and leave no stone unturned when asking and answering questions
This is just the start. There’s significantly deeper analysis you can do with the proper tool and instrumentation. Analyzing user cohorts, interpreting A/B test results, cross-referencing with internal data - the list goes on.
That will be for another post, though.