How to Design Software — Report Generators
Learn how to create a reusable report generation system using the template design pattern

Learn how to create a reusable export generation system using the template design pattern.
Reports. It’s often one of the first features developers are asked to build by the business. Once someone has data, what do they want to do with it?
That’s right — view it.
Engineers have problems with reports
Many engineers approach reports in a use-case particular way.
They’ll get a requirement such as “create a .csv report that displays all purchased items from the store” and they’ll go and create that particular feature.
The next time they may get a request to “create a .csv report of all users belonging to the account” and they’ll go and create that feature as well.
As time goes on, the business asks for different formats, different fields, etc. These requests add up, and after a few iterations, the system ends up with more than a dozen report implementations, all with their own bugs and quirks.
Worse yet, if any major iterations are needed, such as customizability or some new performance improvement, the change will have to be made over and over (and likely slightly differently each time), leading to significant overhead implementation and maintenance costs just to generate a comma-separated list! But, it doesn’t have to be this way. There are some simple techniques you can use to avoid this pain altogether.
What Is a report?
First, let’s understand — what is a report, exactly? Every report has these four basic components:
data records
data values
labels
format
Data records
The data is the actual data that you are using to populate your report. Maybe it is a bunch of events in your system. Perhaps it is transaction data. It’s likely data pulled from your database.
There’s likely a specific scope to the data to limit the data based on some parameter, such as date range.
Data values
It’s not enough to have just the data as a whole. People are often interested in specific data points — specific fields of the data. A financial person may only be interested in dollar amounts of a settlement, whereas a security monitor may be interested in an address mismatch status.
Labels
Labels provide meaning to the data. It’s what distinguishes this…:
5 | 3 | 230 | 40…from this:
id | event_id | amount_paid_cents | fee_paid_cents
5  | 3        | 230               | 40
Labels turn meaningless values into data and provide human-understandable context to otherwise arbitrary values.
Format
Finally, there’s the format of the report. The format could be arbitrary and what format is needed ultimately depends on the consumer. If the consumer is an API, the format might be JSON.
If the consumer is a FTP drop-off or a person intending to import it into another system, it may be a CSV. If the consumer is a data person interested in slicing and dicing, it may end up as an Excel spreadsheet or even a set of database import commands.
What Are the Steps of Generating a Report?
Now that we know the pieces, we can look at the algorithm: what is the sequence of steps needed to generate any kind of report?
Turns out, it’s not a complicated algorithm! It can be encapsulated into the following:
Setup — Get parameters for the report
Fetching records
Map — Get a particular set of fields from each record
Convert each set of fields into an entry in the report
Send the report back to the user
Setup
The first step is setup — sending the parameters into the report to adjust how it behaviors. This is often data used for scoping — some collection of records needs to be filtered and reduced into a subset (eg. by an account, by date, etc.)
Fetch
Once you have the parameters for your report, you’ll want to start retrieving those records. You can apply the filters as appropriate:
Map
You’re likely interested in a particular set of attributes and fields in the record. You can turn your records into that particular set, and optionally enrich each entry with additional data.
Convert
Once you have your collection — in this case, a set of hashes, you’ll want to convert it into a specific format, such as CSV.
Want to support other formats? No problem:
Putting It All Together
Each of the steps above may have its own details, but you can generally encapsulate it into something like below:
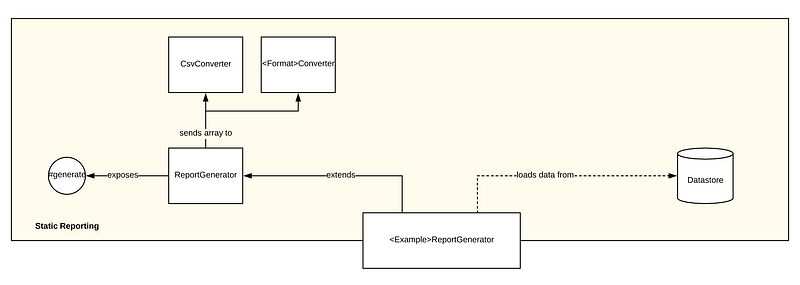
A use-case specific implementation might look like:
Note how easy it is to tie into the existing functionality of a report — you can quickly create many different kinds of reports without worrying about how to generate or deliver them.
If it looks familiar — it’s because it might just be!
This is the template pattern — a design pattern that helps encapsulate the sequence of an algorithm and the implementation of the invariant steps while leaving the variant steps available to be “filled in” by a subclass.
Additional Iterations
There’s a lot of other concerns and possible iterations a report might have, such as:
Performance — record batching, record size management
Customization — specifying headers, changing ordering
Delivery — SFTP, download, email
This functionality can be added to the base class or subclasses as appropriate without changing the overall structure of the system. Standardization of inputs and outputs allows for tie-ins into other parts of your system.
For example, if you already have a module that delivers files via email, you can easily plug in the output of your report generator into that subsystem, or call it from a function like deliver_to_email(email).
That’s it! Creating reusable software that separates the mechanism from the use case, allowing it to be used in many other use cases, is as simple as breaking it down into small parts and thinking carefully about inputs and outputs.
Did you like this article? Let me know in the comments, or connect with me on LinkedIn!